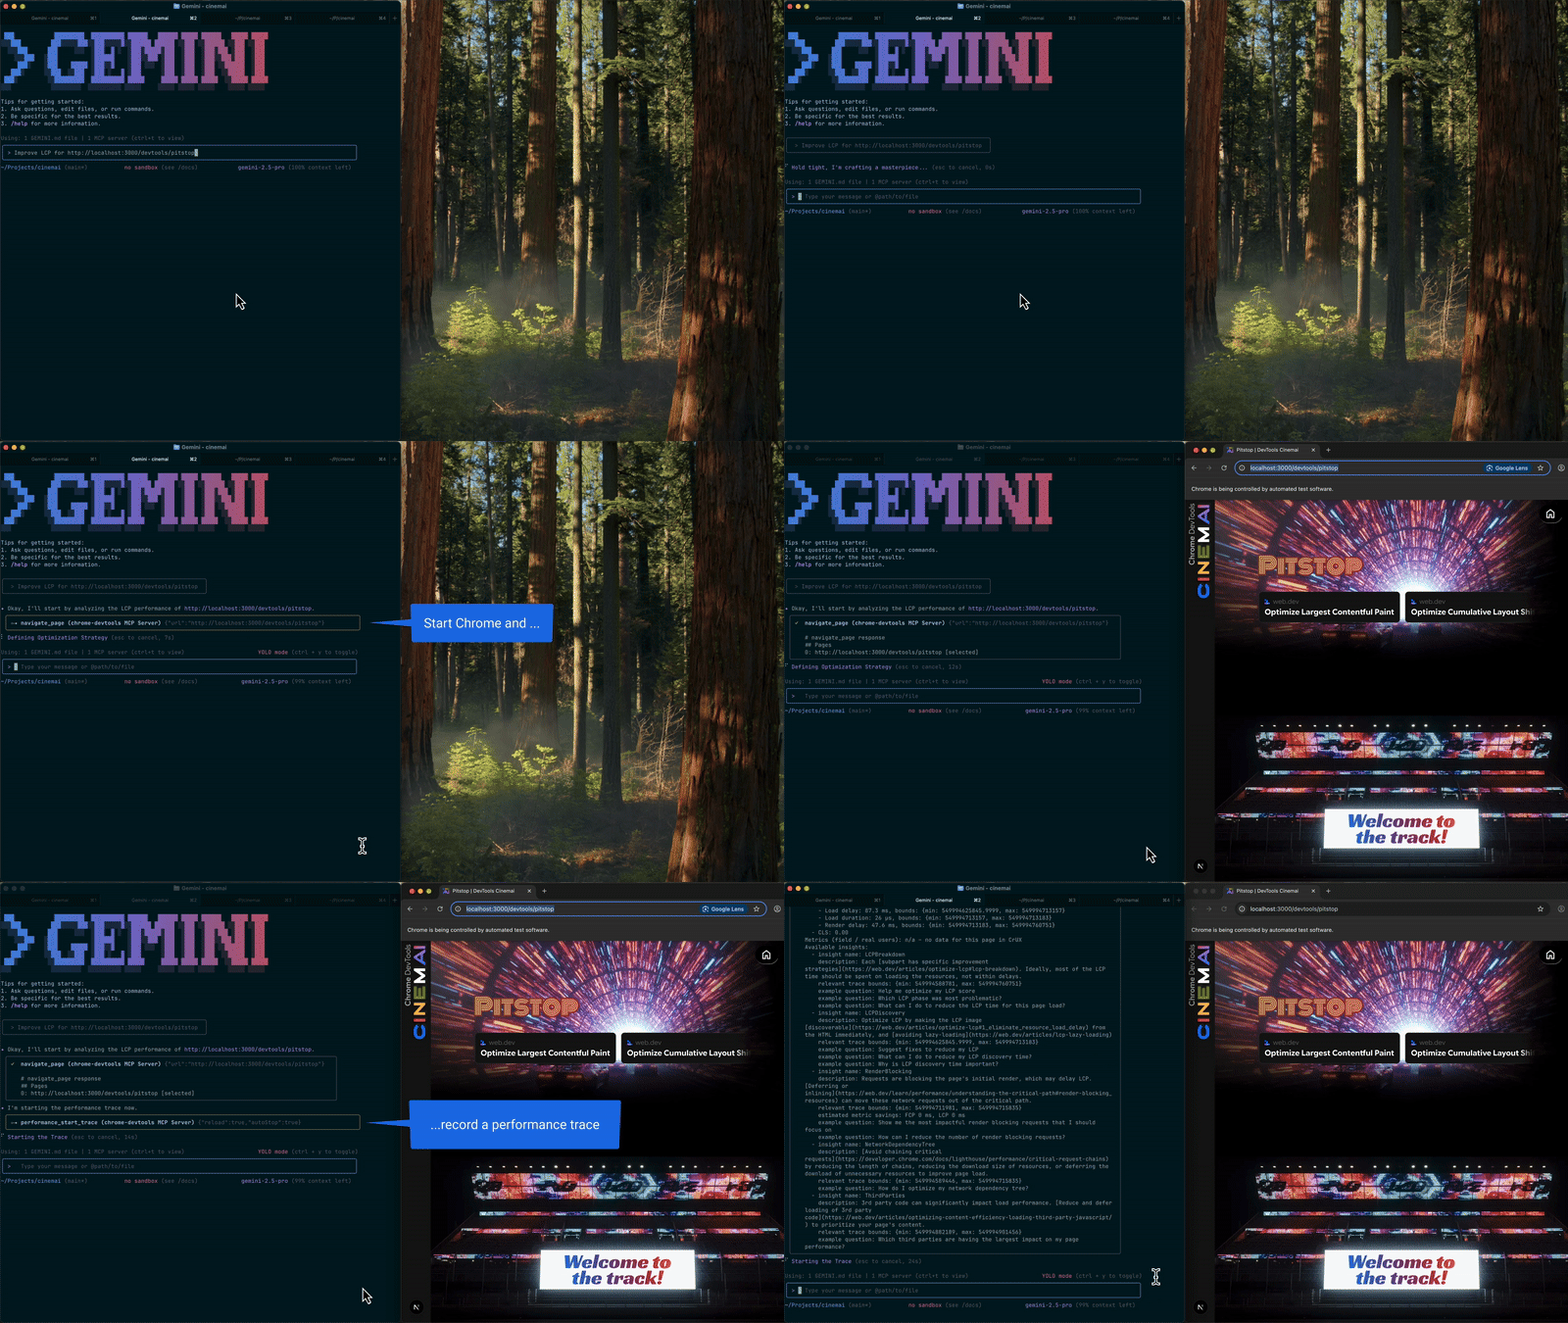
AI coding assistants can write and reason about code, but they can’t see it. They’ll happily refactor a script, or rebuild a layout without ever knowing what actually happens when the browser renders it, producing elegant fixes that fail silently at runtime.
Google wants to change that with Chrome DevTools MCP, a public-preview release that lets AI agents connect directly to a live browser environment through Chrome’s built-in developer toolkit, DevTools.
Using the new Model Context Protocol (MCP) server, models can inspect pages, capture performance traces, read console logs, and even simulate user actions — all through standard DevTools APIs.
In effect, it gives AI assistants something they’ve always lacked: runtime awareness. Models can now observe what happens after their code executes, bringing generation and verification a little closer together.
For context, MCP is an open standard introduced by Anthropic at the tail-end of 2024. It defines a common way for AI agents to connect to external tools, APIs, or data sources — essentially, a lingua franca for context-aware models.
Available under an open source Apache 2.0 license, Chrome DevTools MCP runs as a lightweight local service bridging an AI agent and the browser. Developers can clone the project on GitHub, start the server, and register it with their preferred MCP-compatible client — whether that’s Claude Code, Cursor, Copilot, or Googles’ own Gemini.

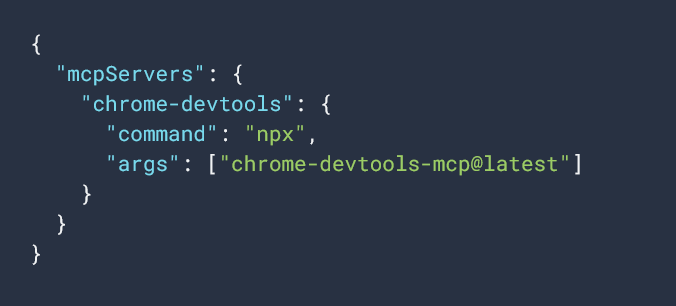
Setup is fairly minimal: add a short MCP config block pointing to the DevTools server via npx, and the client will always pull the latest version automatically.

Once connected, the AI gains access to a suite of Chrome debugging endpoints via DevTools — performance tracing, network inspection, DOM exploration, and more — effectively giving the model a pair of eyes inside a live webpage.
Chatter has been fairly fervent across the social landscape. On Reddit, one early user described Chrome DevTools MCP as “like Playwright, but WAY smarter” (Playwright being Microsoft’s browser automation framework), praising its ability to debug pages, fix console errors, and resolve 500s automatically.
Other developers chimed in to note that Microsoft already offers a Playwright MCP of its own, with a similar purpose — giving AI agents live browser access. But the two tools are taking different paths. Chrome DevTools MCP integrates with Chrome’s native debugging stack through DevTools and Puppeteer (Google’s library for automating and controlling Chrome), while Playwright MCP runs on Microsoft’s cross-browser automation framework.
That distinction matters: Google’s version leans toward deep debugging and runtime inspection, whereas Microsoft’s favors browser automation and multi-engine reach.
However, some of the more interesting tidbits to emerge from the community have actually been around how developers are putting DevTools MCP through its paces.
For example, a DebugBear walkthrough shows how the tool can capture live performance traces and feed them back to an AI assistant for analysis — helping the model identify layout shifts, slow scripts, and other bottlenecks in real time.
Another developer used Chrome DevTools MCP to reverse-engineer an undocumented API, instructing Claude to inspect live network traffic until it reconstructed the site’s hidden endpoints and auto-generated a working client.
Elsewhere, the folks at digital marketing agency Go Fish integrated DevTools MCP into Cursor to automate SEO and geo-targeting research. This lets an AI agent browse search engine result pages (SERPs), extract metadata, and run performance audits without leaving the coding environment.
Collectively, these early experiments show how developers are treating DevTools MCP not just as a debugging bridge, but as a general-purpose interface layer between AI reasoning and live browser data — giving models visibility into code as it executes. It’s a small but meaningful move toward self-verification, where models can check what their code actually does.